On this page
What is data visualization in AI?
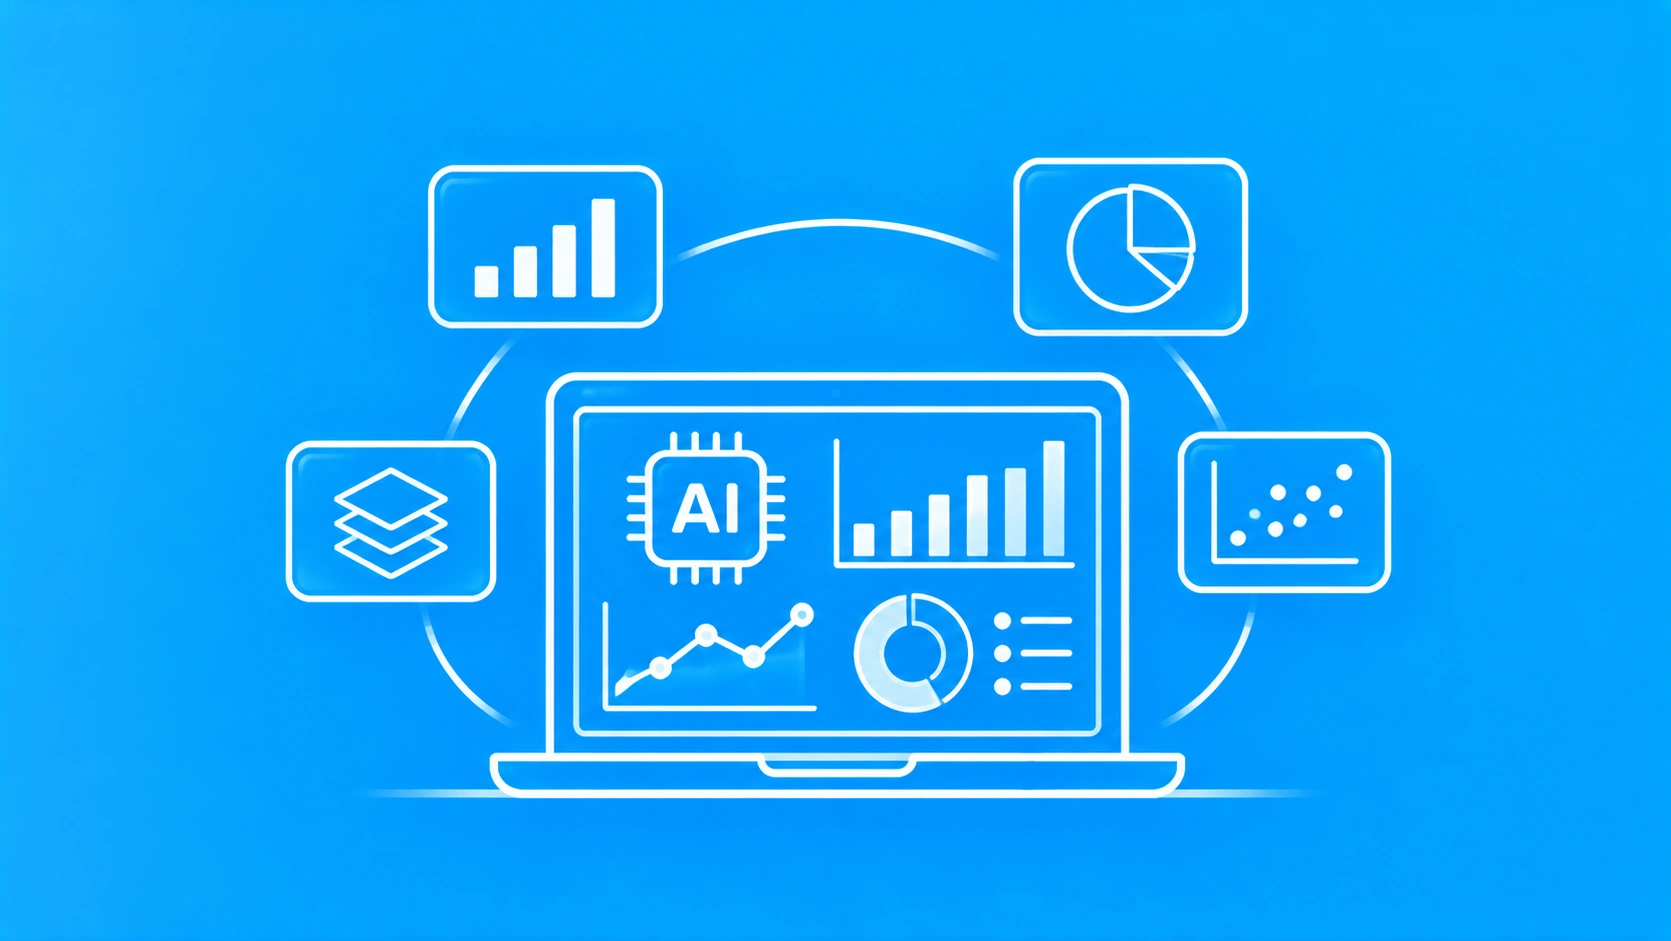
Data visualization in AI is the use of artificial intelligence to prepare data, choose the right chart and explain what the chart shows. A traditional dashboard waits for an analyst to build every view by hand. An AI-powered dashboard builds views on request, highlights unusual patterns and writes a short summary of the trend.
The term covers two related ideas. The first is AI that creates visualizations of business data. The second is visualization that helps people understand AI itself, such as charts of model accuracy and drift. This post focuses on the first idea, because that is what most product and data teams buy and build.
Why does data visualization in AI matter for decision-makers?
AI-powered visualization matters because it cuts the time between a business question and a usable answer. A manager no longer waits days for an analyst to build a report. The manager asks the question, sees the chart and decides, while the analyst checks the logic and handles the harder work.
Market demand reflects this shift. Fortune Business Insights’ data visualization market report values the global market at USD 12.24 billion in 2025 and forecasts USD 34.07 billion by 2034, a 12.05% annual growth rate. North America held the largest share, at 43.39% in 2025.
Three groups gain the most from AI dashboards:
- Executives get plain-language summaries of the metrics they own.
- Analysts spend less time building routine charts and more time on deeper analysis.
- Frontline teams get alerts when a number moves outside its normal range.
How does AI change data visualization? 5 core capabilities
AI changes data visualization in five ways: it understands plain-language questions, generates insights automatically, detects anomalies, processes live data and forecasts what comes next. Most modern tools combine several of these capabilities in one interface.
Natural language queries
Natural language queries let users ask questions in everyday words instead of SQL. The capability rests on natural language processing, the branch of AI that helps software understand human language. Ask “Which products sold best last quarter?” and the tool returns a ranked bar chart.
Automated insight generation
Automated insight generation means the tool scans a dataset and surfaces the patterns worth attention. It can point out a sales dip in one region or a sudden rise in support tickets without anyone asking. This saves time and reduces the risk that a key trend sits unnoticed in a spreadsheet.
Anomaly detection
Anomaly detection is the process of finding data points that differ sharply from the normal pattern. In a dashboard, an anomaly might be a payment spike at 3 a.m. or a sensor reading far above its usual range. AI flags these points visually so teams can investigate quickly.
Real-time dashboards
Real-time dashboards update as new data arrives instead of once a day. An e-commerce team can watch traffic during a sale and shift ad spend within minutes. Real-time views need a streaming data pipeline underneath, which adds engineering work and cost.
Predictive analytics and forecasting
Predictive analytics uses historical data and machine learning models to estimate future values. A forecast line on a chart might show expected demand for the next eight weeks, with a band for uncertainty. Forecasts help planning, but they assume the future resembles the past, so teams should review them regularly.
Which AI data visualization tools lead in 2026?
The leading AI data visualization tools fall into three groups: governed BI platforms with AI assistants, conversational AI tools that analyze uploaded files, and custom builds on open-source libraries. The right group depends on who reads the output and how costly a wrong number would be.
Leading AI data visualization tools in 2026
| Tool | Type | Main AI feature | Best for |
|---|---|---|---|
| Microsoft Power BI | Governed BI platform | Copilot builds report pages, summaries and DAX queries | Teams already on Microsoft tools |
| Tableau | Governed BI platform | Tableau Pulse sends AI insights on followed metrics | Teams that want metric digests |
| Looker | Governed BI platform | Gemini assistant for natural-language analysis | Google Cloud users with a semantic layer |
| ThoughtSpot | Search-based BI | Natural-language search over business data | Self-serve analysis for business users |
| ChatGPT or Claude | Conversational AI | Writes and runs code to chart uploaded data | Quick exploration of small datasets |
| Custom build | Code libraries plus an LLM | Charts tailored to your product and data | Products that embed analytics for customers |
Vendors rename AI features often, so check each name against current documentation before you choose.
Governed BI platforms
Governed BI platforms suit reports that executives and regulators rely on. Microsoft’s overview of Copilot in Power BI explains that Copilot can create report pages, summarize a semantic model and write DAX queries. It also warns that poorly prepared data can lead to misleading answers.
Tableau’s documentation for Tableau Pulse describes how users receive personalized AI insights about the metrics they follow. In both platforms, the governance layer keeps metric definitions the same across every report.
Best for: recurring executive reporting on shared, well-defined metrics.
Conversational AI tools
Conversational AI tools such as ChatGPT and Claude analyze a file you upload, write the code and draw the chart. They are fast and show their working, which makes the logic easy to check. They usually do not enforce shared metric definitions across a team, so treat their output as a first draft.
Best for: one-off exploration by an analyst who will verify the result.
Custom AI dashboards
A custom AI dashboard combines charting libraries such as D3.js or Plotly with a large language model and your own data pipeline. This route costs more upfront but gives full control over design, data access and compliance. It suits software companies that want analytics inside their own product.
Companies without in-house machine learning engineers often work with an AI development company to build and maintain this layer.
Best for: products that embed analytics for their own customers.
Where is AI data visualization used? 4 industry examples
AI-powered dashboards are used most in industries with large, fast-moving datasets: healthcare, finance, retail and manufacturing. In each industry, the aim is the same: to spot a risk or opportunity earlier than a manual report would.
Healthcare
In healthcare, AI dashboards help clinicians and administrators see patterns in patient data, bed occupancy and readmission risk. A risk score shown as a color-coded chart is faster to act on than a table of lab values.
Health dashboards in the United States must protect patient data under the Health Insurance Portability and Accountability Act (HIPAA) Privacy Rule. Hospitals that need these dashboards built into their own systems often hire a healthcare software development company with compliance experience.
Finance
In finance, analysts use AI visualization to track market movements, credit risk and fraud signals in real time. A transaction network graph can reveal a ring of linked accounts that a plain list would hide. The wider set of models behind these dashboards is covered in our post on AI in fintech.
Retail
In retail, AI dashboards show which products sell, where and to whom. Forecast charts help planners set stock levels before demand peaks. Customer segment views help marketers tailor offers to real buying patterns instead of guesswork.
Manufacturing
In manufacturing, AI dashboards monitor equipment health and production output. A visual alert can warn that a machine shows early signs of failure, so maintenance happens before a breakdown. This predictive maintenance approach reduces unplanned downtime, though results depend on sensor coverage and data quality.
How to implement data visualization in AI: 6 steps
The fastest way to implement AI data visualization is to start with one decision, one metric and one audience, then expand. Teams that begin with a company-wide platform rollout can stall for months on data cleanup.
Step 1: Choose one decision to improve
Start with a decision someone makes often, such as weekly stock orders or daily staffing. A clear decision tells you which data matters and what a useful chart looks like.
Step 2: Define the metric in writing
Write down exactly how the metric is calculated, including filters and date rules. AI tools guess when a definition is vague, and a confident chart built on a wrong definition is worse than no chart.
Step 3: Audit and clean the data
Check the source data for gaps, duplicates and inconsistent formats before you connect any AI tool. Data quality decides answer quality, so this step often takes the most time.
Step 4: Choose the tool type
Match the tool to the audience: a governed BI platform for executive reports, a conversational tool for exploration or a custom build for customer-facing analytics. Use the tools comparison table in this post to shortlist two options.
Step 5: Pilot with real users
Run a four to six week pilot with the people who make the decision. Track whether they act faster and whether the AI answers match a manual check of the same numbers.
Step 6: Add governance and scale
Once the pilot works, set access controls, review rules for AI-generated summaries and a schedule for accuracy checks. Then add the next decision and metric.
What are the main challenges of AI data visualization?
The main challenges of AI data visualization are poor data quality, overconfident AI summaries, privacy risk and weak governance. Each challenge is manageable with clear rules set before launch.
- Data quality: missing or duplicated records produce misleading charts, however polished the visual looks.
- Overconfident summaries: AI narratives can sound causal when the data only shows a correlation, so a person should review any claim about why a number moved.
- Privacy: dashboards that show personal or health data need role-based access, audit logs and compliance with local privacy law.
- Governance: each metric needs a named owner and a process for checking AI output over time.
The NIST AI Risk Management Framework offers a voluntary structure for this governance work. It organizes AI risk management into four functions: govern, map, measure and manage.
Best practices for AI data visualization
Reliable AI dashboards share five habits:
- Keep one written definition for every metric, stored where the AI tool can read it.
- Show the calculation behind each AI answer through code, SQL or a formula view.
- Design for the least technical reader, with clear labels and plain-language summaries.
- Train teams to question AI summaries, especially claims about causes.
- Compare a sample of AI answers with manual checks every month.
What comes next for data visualization in AI?
The next stage is agentic analytics, where AI agents monitor metrics, investigate changes and prepare reports with little prompting. An agent differs from a chatbot because it plans and acts across several steps. Our comparison of AI agent vs chatbot explains the difference in detail.
AI agents also need secure access to company data. The Model Context Protocol (MCP) is an open standard for connecting AI models to external data sources and tools. MCP Server Development shows how teams expose their data to agents this way.
Teams that want agents built around their own data and dashboards often work with an AI agent development company.
Summing up
Data visualization in AI turns raw data into charts and summaries that people can act on quickly. Governed BI platforms suit executive reporting, conversational tools suit fast exploration and custom builds suit products that embed analytics. Whatever you choose, clear metric definitions and clean data decide whether the charts can be trusted.

Sunil Kumar is CEO of Ailoitte, an AI-native engineering company building intelligent applications for startups and enterprises. He created the AI Velocity Pods model, delivering production-ready AI products 5× faster than traditional teams. Sunil writes about agentic AI, GenAI strategy, and outcome-based engineering.
About Ailoitte